📊 Unified Dashboards
Trends by building & department with weather normalization, peak demand, and cost overlays.
GreenElectron gives universities and large organizations a unified dashboard to monitor usage, detect unusual patterns, and convert kWh and therms into real carbon impact and avoided costs.
Trends by building & department with weather normalization, peak demand, and cost overlays.
Automatically surface weekend spikes, schedule drift, or leaks — with human‑readable explainers.
Convert kWh/therms to tCO₂e via grid‑region factors. Track reductions across semesters or fiscal periods.
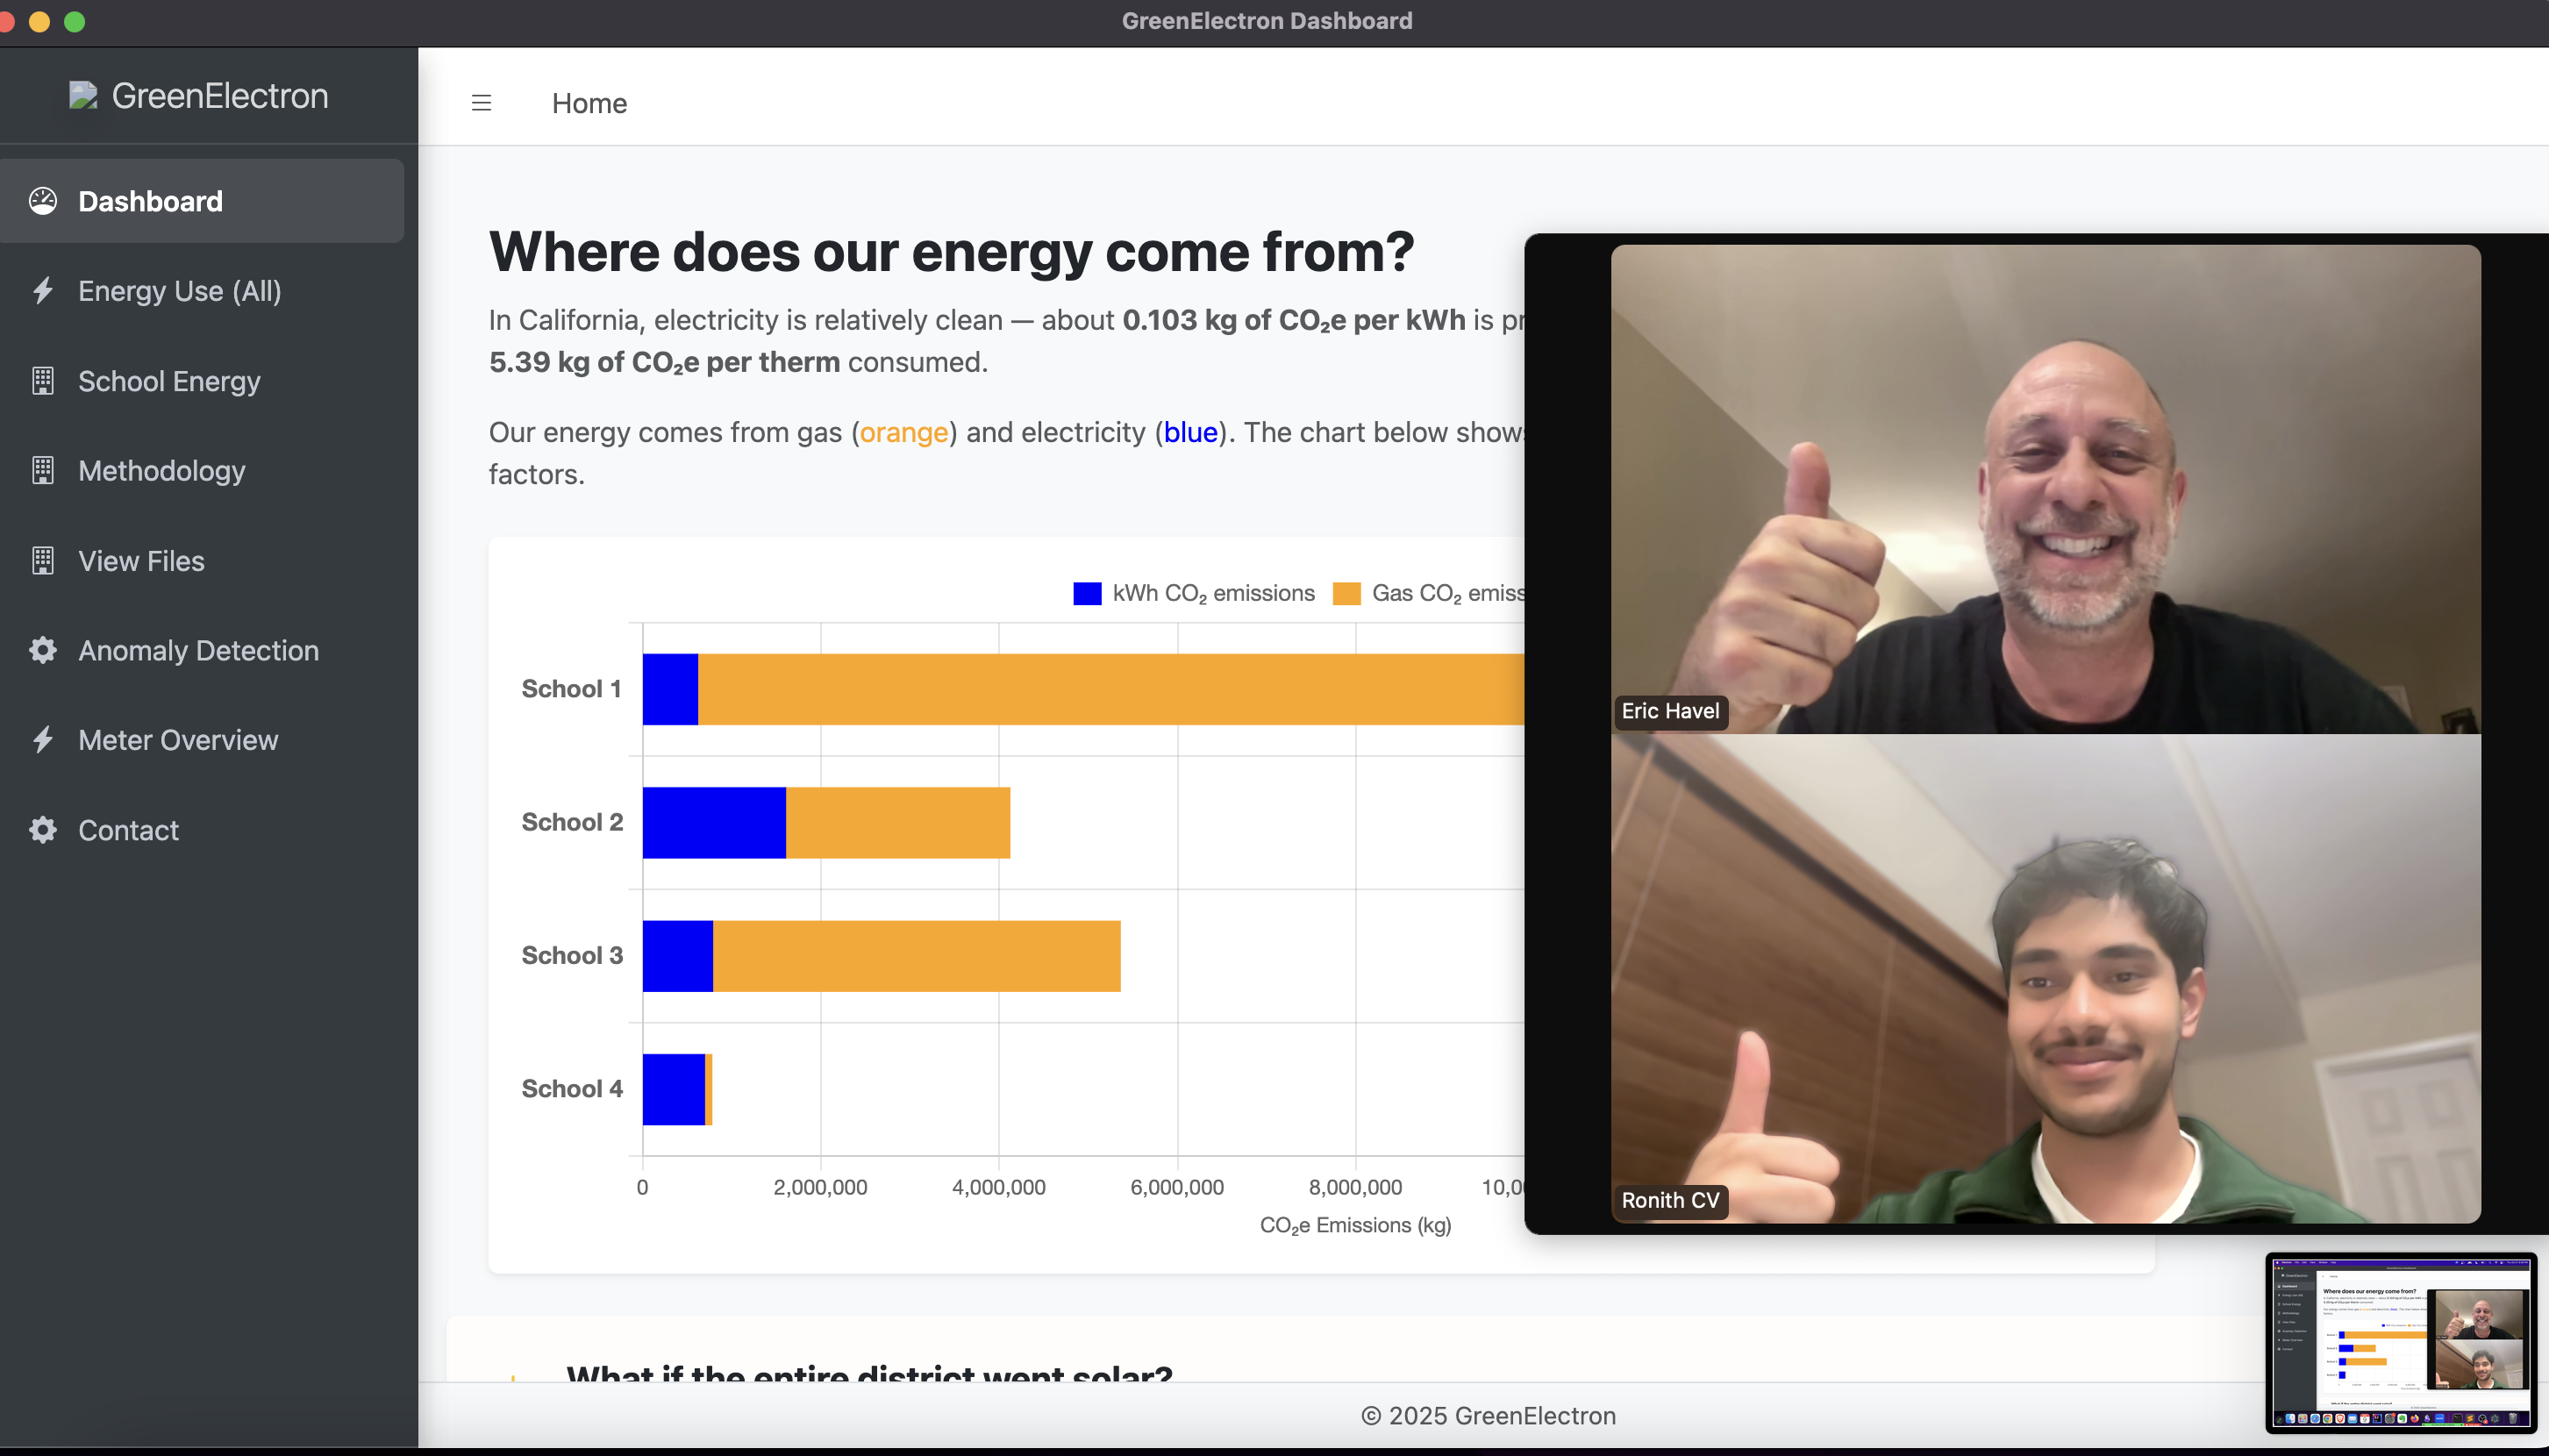
Here’s me demoing GreenElectron to districts and cities. See where it’s been shown and how teams use it to visualize energy and spot anomalies.
"I would like to share my endorsement of the GreenElectron app that was developed by high school student Ronith. I work closely with students, teachers and school district administrators to create and implement sustainability projects at school sites throughout the East Bay. This app is a great tool that can be used to help schools understand things like their energy consumption, carbon footprints and where there are opportunities for schools to both reduce their overall environmental impacts as well as potentially save significant amounts of money being spent on operational costs. I'm very excited to share this tool with schools that I'm currently working with, and I hope that you will consider doing the same!"
— Eric Havel, Environmental Literacy Education, Community Resources for Science
Download the compiled app for your platform. Includes demo data for a quick tour.